A note reaches velocity 127 only when its running RMS level is −2.22 dBFS or hotter. That is quieter than it sounds, but harder to reach than it looks: −2.22 dBFS means the note's crest factor has to be 2.22 dB or less, and the loudest a clean sine wave can ever get at full scale is velocity 125. Everything below is measured on this site's own analyser (dsp.js), not quoted from anywhere else.
Velocity here comes from exactly one number: the average RMS of the frames a note occupies. There is no normalisation against the rest of the file, no per-track scaling, and no guesswork. That has a practical consequence you can measure in a minute — turn a file down by 6 dB and every note in the resulting MIDI comes out 11 velocity steps quieter. We did exactly that, and it came out at −11 steps on all eight test notes.
The formula, straight from the source
Every note is written by the same function, in both detection modes. The mean RMS is taken over the note's own frames, converted to decibels, and mapped onto the MIDI range:
rms = mean of frame RMS over the note's frames   // frame = 2048 samples = 92.88 ms at 22050 Hz
db  = 20 * log10(rms)
vel = round(20 + (db + 60) * (100 / 54))
vel = clamp(vel, 1, 127)
Three things follow from it, and all three are visible in the measurements below:
- It is absolute, not relative. Nothing is scaled against the loudest note in the file. A quiet file produces quiet MIDI, always.
- One decibel is worth 1.85 velocity steps (100/54). A 6 dB change is worth 11 steps. Measured over −30 to −6 dBFS, the step count came out at 2 per dB most of the time and 1 occasionally — the rounding.
- The floor is 1 and the ceiling is 127. The formula passes 20 at −60 dBFS, and we measured it bottoming out at 1 at about −69.7 dBFS.
Measured: level in, velocity out
| Level (dBFS) | Velocity | Level (dBFS) | Velocity |
|---|---|---|---|
| −3.01 | 125 | −29.03 | 77 |
| −4.95 | 121 | −36.99 | 62 |
| −7.45 | 117 | −43.01 | 51 |
| −9.03 | 114 | −49.03 | 40 |
| −10.97 | 110 | −56.99 | 25 |
| −13.47 | 106 | −63.01 | 14 |
| −16.99 | 99 | −69.03 | 3 |
| −23.01 | 88 |
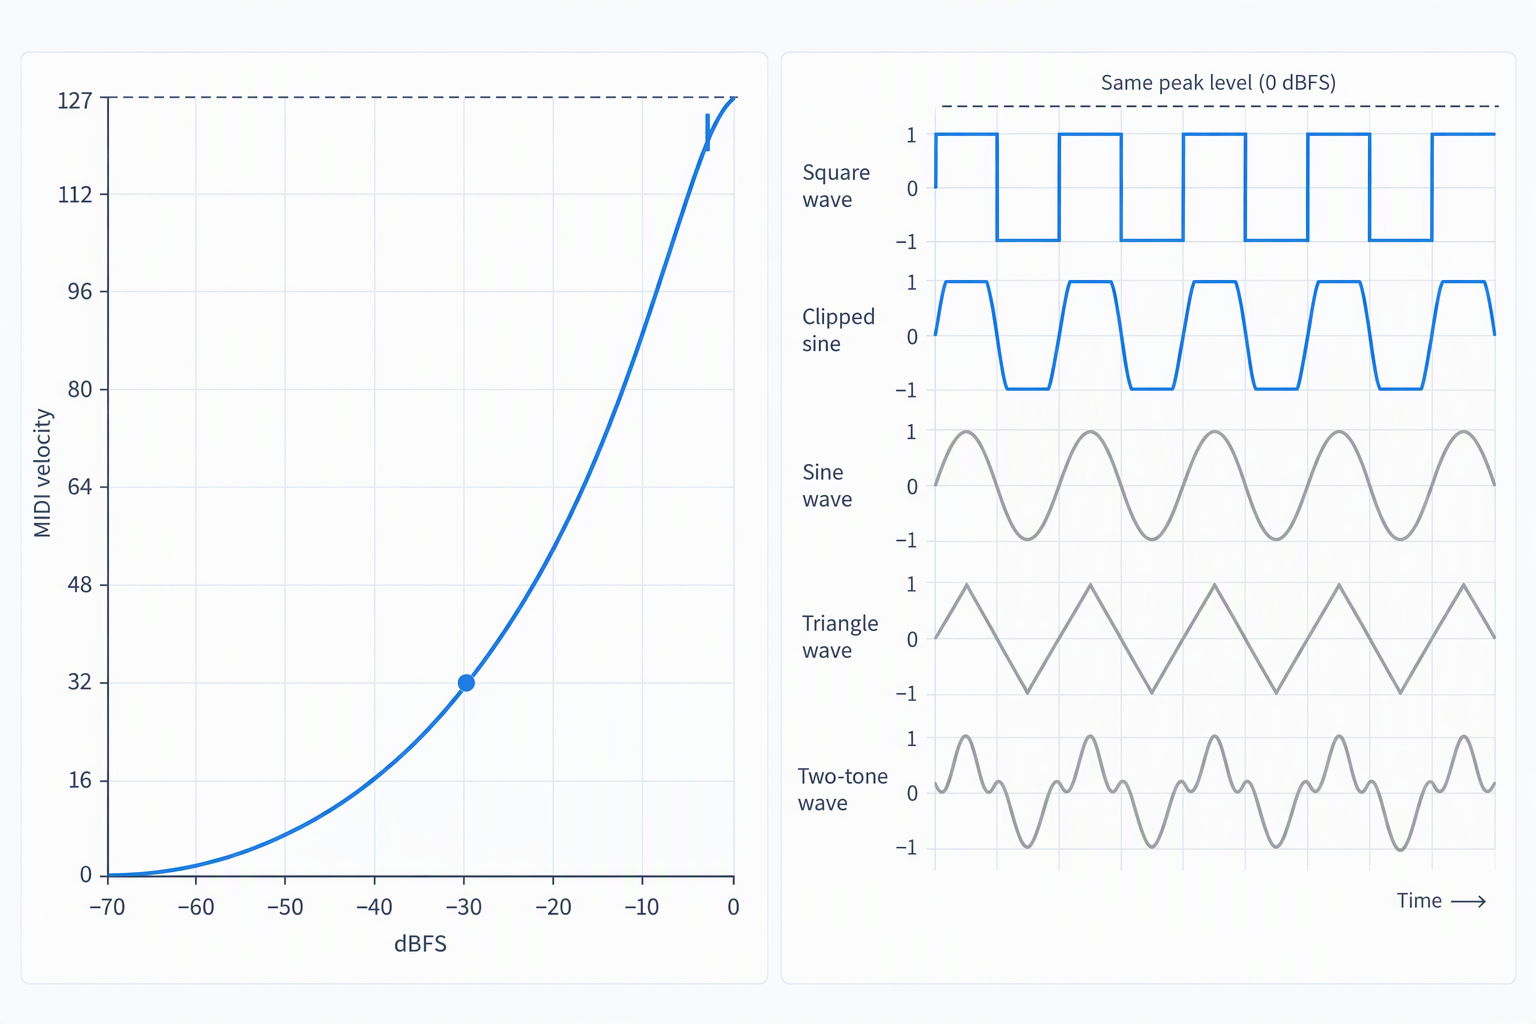
Read the top row carefully, because it is the answer to the question in the title. −3.01 dBFS is the RMS of a sine wave whose peaks touch digital full scale. It gives velocity 125. A pure sine cannot be made any louder without clipping, so no clean sine wave, at any level, ever reaches 127 in this implementation.
What actually reaches 127: crest factor
Peak level and RMS level are only the same thing for a square wave. Everything else sits lower, and the gap between the two is the crest factor. Once a file is peak-normalised to 0 dBFS, the formula collapses into a rule of thumb that we then checked against real waveforms:
velocity ≈ round(131.1 − 1.85 × crest factor in dB) // for material peaking at 0 dBFS| Waveform | Crest (dB) | RMS (dBFS) | Velocity |
|---|---|---|---|
| Square wave | 0.07 | −0.07 | 127 (clipped) |
| Hard-clipped sine | 1.18 | −1.18 | 127 |
| Sine | 3.08 | −3.08 | 125 |
| Triangle | 4.84 | −4.84 | 122 |
| Two-tone (fifth) | 5.66 | −5.66 | 121 |
We then bisected the level of the clipped sine to find the exact ceiling. At −2.25 dBFS the velocity is still 127; at −2.39 dBFS it drops to 126. That brackets the −2.22 dBFS the formula predicts.
So the honest answer to "how loud does it have to be" is: loud enough that its average level sits within 2.22 dB of its own peaks. That is limiter territory. If every note in your MIDI file comes out at 127, the source is squashed, not expressive.
The envelope moves velocity as much as the level does
RMS is an average over the whole note, so a note that decays quickly reads quieter than a note that holds, even when both hit the same peak. Same peak level (0 dBFS), same 400 ms length, only the decay time changed:
| Decay time constant | Crest (dB) | Velocity |
|---|---|---|
| 50 ms | 14.70 | 107 |
| 100 ms | 11.86 | 109 |
| 200 ms | 9.03 | 112 |
| 400 ms | 6.63 | 118 |
| 800 ms | 5.02 | 121 |
| No decay (flat) | 3.08 | 125 |
A second run at a fixed level, 300 ms notes, made the same point harsher: a 20 ms decay gave velocity 89 where the same note held flat gave 114. That is a 25-step spread from envelope alone, with no change in peak level at all.
MP3 bitrate does nothing to velocity. Level does everything.
This is the part that matters if you are feeding MP3s into a converter. We built an eight-note C-major clip with a deliberate dynamic curve (amplitudes 0.90, 0.45, 0.70, 0.30, 0.80, 0.55, 0.35, 0.95), encoded it with LAME at four bitrates, decoded it back, and ran all five versions through the analyser:
| Version | 1 | 2 | 3 | 4 | 5 | 6 | 7 | 8 |
|---|---|---|---|---|---|---|---|---|
| Source WAV | 123 | 112 | 119 | 106 | 122 | 115 | 108 | 124 |
| MP3 320 kbps | 122 | 111 | 119 | 105 | 121 | 115 | 107 | 123 |
| MP3 192 kbps | 122 | 111 | 119 | 105 | 121 | 115 | 107 | 123 |
| MP3 128 kbps | 122 | 111 | 119 | 105 | 121 | 115 | 107 | 123 |
| MP3 64 kbps | 122 | 111 | 119 | 105 | 121 | 115 | 107 | 123 |
| Same WAV, −6 dB | 112 | 101 | 108 | 95 | 110 | 104 | 97 | 113 |
Two findings, and they point in opposite directions:
- Bitrate is irrelevant to velocity. 320, 192, 128 and 64 kbps produced byte-identical velocity sets. The whole encode/decode round trip cost an average of 0.75 velocity steps, which is the LAME encoder's own level shift of about 0.45 dB — well under one step of resolution.
- Level is decisive. Turning the same file down 6 dB moved all eight notes down by 11 steps. Same waveform, same performance, completely different dynamics in the MIDI.
Two caveats we will not paper over: this test used eight synthesised sine notes, not a real master, and the encode/decode chain was LAME through ffmpeg 7.1. A browser's own MP3 decoder may land a fraction of a decibel elsewhere. The size of the effect is what matters — level moves velocity by 1.85 steps per dB, and the bitrate moved it by less than one.
MP3 bitrate does not bring back lost notes either
The test above shows bitrate leaves velocity untouched. It also leaves the note pitch untouched in a different sense: an MP3 has already lost low-frequency detail during encoding, so those notes may never reach the converter at all. That is a separate problem from velocity, and worth reading on its own — see whether MP3 to MIDI loses notes vs WAV (measured) for the FFT-resolution explanation and a way to test your file.
What does not change velocity
Three controls people reach for, measured:
| Control | Setting | Velocity |
|---|---|---|
| Sensitivity | 0 / 20 / 40 / 60 / 80 | 114 |
| Sensitivity | 100 | 113 |
| Detection mode | monophonic | 114 |
| Detection mode | polyphonic | 112 |
The sensitivity slider decides which frames become notes; it does not touch the velocity arithmetic, so moving it will not rescue a flat or a blown-out velocity map. Monophonic and polyphonic modes share the same velocity line of code — the one-step difference above comes from the two modes claiming slightly different frames at the note edges, not from a different rule. Quantisation also leaves velocity alone: the note is measured first, and only its start and end times are moved afterwards.
One more signal worth knowing: on the demo file shipped with this site, all eight notes came out at velocity 113–114. That is not a bug, that is what a constant-amplitude synthesised clip looks like. If your own conversion comes out equally flat, the source had no level variation across the notes.
How loud does a note need to be, in one minute
The video is a one-minute visual summary of the measured curve above: the louder and more compressed the source gets, the closer the meter approaches 127, and it stops short of 127 for any clean waveform at full scale.
How to check your own file in four steps
- Convert the file and export the note list as CSV. The columns are
index, midi_note, note_name, start_sec, end_sec, duration_sec, velocity, with times to four decimal places. - Look at the spread of the velocity column. If the minimum and the maximum are the same number, you either have a constant-level source or a file sitting on the ceiling.
- Change the file's level by a known amount in any editor — 6 dB is easy to hit — convert again, and diff the two CSVs. Every velocity should move by about 11. If it does not, the conversion is not tracking level at all.
- If most notes sit at 127, turn the file down before converting. If most sit below about 70, the file is simply quiet relative to full scale; raising the level is the whole fix, because nothing here is normalised for you.
What "best MP3 to MIDI converter" can actually mean
Short answer: "best" is not a ranking you can read off a list here — for this engine it is a property of your file. Run one clip through and check the six boundaries below; every number comes from the constants in our DSP or from a clip we ran through it. Inside those boundaries this converter does the job; outside them, no slider setting makes it the best.
| Boundary | Value in this engine | What to check in your clip |
|---|---|---|
| Lowest pitch | F_MIN = 55 Hz (A1) | A 41.2 Hz tone with harmonics returns 0 notes at sensitivity 60 and 80; a 55 Hz sine returns A1. Sub-bass is not transcribable here. |
| Low-frequency resolution | 2048-point window at 22050 Hz = 10.77 Hz per bin | Below ~181 Hz (near F#3) a semitone is narrower than one bin, so low notes blur together. |
| Peaks per frame | MAXP = 6 peaks per 11.610 ms frame | A dense 8-note chord came back as 17 note objects, not 8. Past the ceiling, notes flicker and fragment rather than vanishing. |
| Shortest note | minFrames = round(minms / 1000 / frameT) | At the 60 ms minimum-note setting that is 5 frames = 58.05 ms, and the first and last ramp frames still have to survive the gate. |
| Salience gate | salThr = 0.35 − 0.25 × sens (0.20 at sensitivity 60) | If clean notes vanish, raise sensitivity before re-recording: a frame whose harmonic salience falls under this line is discarded. |
| Pitch movement | Only 0x90 / 0x80 note events are written | A 440→494 Hz glide becomes 3 stepped pitches and 0 pitch-bend events. Slides are not preserved. |
The tempo you enter is written into the file unchanged, and the engine never normalises your level — the velocity measurements above are the proof. The whole analysis runs locally in the browser, so the audio is never uploaded; that is a property of the page, not a claim about anybody else's service.
Which of the three routes is yours:
- Convert it here if the part is single-line, sits inside 55–1800 Hz and holds notes well past the 60 ms minimum: a clean four-note test phrase returns 4 onsets, each under 1 ms off the beat.
- Install a specialised tool if you need pitch bend, source separation or per-instrument parts: this writer emits 0 pitch-bend events and always 1 note track on 1 channel.
- Finish it in a DAW if you need key signatures, lyrics or named parts: the meta events are only tempo, time signature and end-of-track — we counted them byte by byte.
Where the note list lands frame by frame is in where the note boundaries land; if a conversion dropped notes, the four-step order to fix it starts with the format, not the sensitivity slider.
What other transcription approaches may do differently
Approaches built on learned models can emit pitch-bend events and separate sources before transcription. Those are real capabilities, but they answer different inputs than a browser FFT detector with a 55 Hz floor and a 6-peak-per-frame ceiling. The comparison that matters is the one you can run yourself: convert a file, export the CSV, and check the note list against the six rows above.
Questions people actually ask
Does the MP3 bitrate change the MIDI velocities?
No. We encoded the same eight-note clip at 320, 192, 128 and 64 kbps and got identical velocities from all four, within 0.75 steps of the source WAV. Bitrate changes what survives in the audio; it does not change the level the converter reads. What changes velocity is the file's level — 1.85 steps for every decibel.
Why does every note come out at the same velocity?
Because velocity is the mean RMS of that note's frames, and your notes all have the same mean RMS. This is common with synthesised or heavily compressed material: on the demo clip shipped with this site, all eight notes land at 113–114. Real recordings vary, but only by as much as their level actually varies — if a compressor removed the variation before you converted the file, the MIDI will be flat too.
Can I fix the velocities with the sensitivity slider?
No. We swept sensitivity from 0 to 80 on the same note and velocity stayed at 114; at 100 it moved to 113, and only because the note picked up a frame at the edge. Sensitivity controls which frames qualify as a note. Velocity is computed from loudness afterwards, so no threshold setting will change it. Change the file's level, or edit the velocities in your DAW.
Why did converting audio to MIDI change my velocities?
It is not random, even though it looks that way — this is a question people have asked out loud on production forums, usually after noticing that "some notes are now much louder" while the change "doesn't reflect the audio volumes". Two notes that look equally loud on a peak meter can read very differently here, because what is measured is the average level across the whole note, and a note that decays quickly averages lower. A 20 ms decay and a flat sustain at the same peak level differed by 25 velocity steps in our test.
How does audio to MIDI decide each note's velocity?
Velocity comes from how loud each note is in the recording. The converter takes the average level of the frames that make up a note and maps it to a value from 0 to 127, reaching the maximum 127 at around −2.22 dBFS. Louder notes get higher velocity; quieter ones get lower, so a performance with natural dynamics keeps its accents in the MIDI. It is a per-note loudness reading, not a fixed value — which is why a heavily compressed file can come back with every note at nearly the same velocity.
Related guides
- Why MP3 to MIDI loses notes that WAV keeps — what compression does to pitch detection, not to loudness.
- Where the note boundaries land — the frame grid and the beat grid, measured.
- How many notes a converter can hold at once — the polyphony ceiling.
- What is actually inside a MIDI file — the bytes, offset by offset.
- Measured accuracy on 11 test clips — what it gets right and where it fails.
- Audio to MIDI free — What the top tools actually return
- WAV to MIDI converter — What bit depth actually changes
- AI audio to MIDI — What actually decides every note
Everything on this page is measurable on your own machine: convert a file, export the CSV, and check the velocity column against the numbers above.